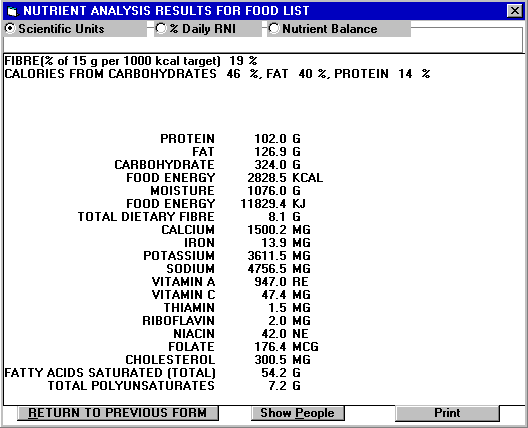
The scientific units option shows you the amount of each nutrient as a number (such as Protein 102.0 grams). Unless you are very familiar with nutrition (so that grams of fat really mean something to you), these numbers may be the least useful option.
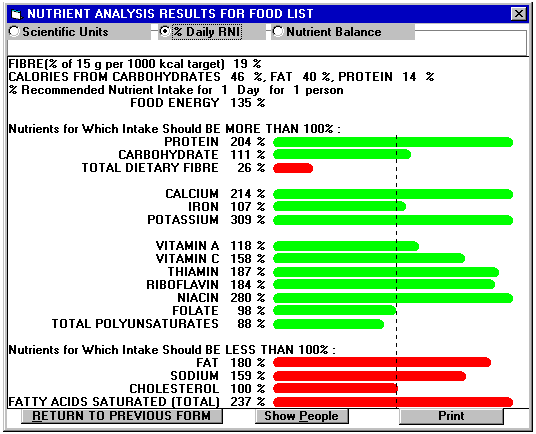
The Daily Recommended Nutrient Intake (RNI) option compares the nutrients in the foods to nutrient recommendations. There are several things you should note about this display option:
- The summary analysis information (fibre and percent of calories from carbohydrates, etc) is repeated here.
- The food energy is shown.
- The nutrient recommendations depend upon the people you selected and
the length of time involved. (See lesson 13 if
you want to change the description of the people who will eat the food
or change the time period which is set to one day unless you change it.)

- The nutrients are divided into two groups. The top group is one in which you should get at least 100% of the Recommended Nutrient Intake or guideline. The lower group is one in which you should get less than 100% of the nutrient guideline. This lower group includes total fat, sodium, chloresterol and saturated fat.
- The colour code is the same as a traffic light- green means safe/low risk, red means higher risk and yellow means caution. The vertical dashed line indicates the 100% point for the bar charts.
You should understand the intent of Health Canada Recommended Nutrient Intakes (RNI's). They are intended to be prudent recommendations that are appropriate for a wide variety of people. Just because you do not meet RNI's does not mean that your body is suffering from a nutrient deficiency but the risk increases as the degree to which you do not meet RNI's increases. There is a lot which is still unknown about nutrition but you will be taking advantage of some of the best experts available if you meet RNI's.
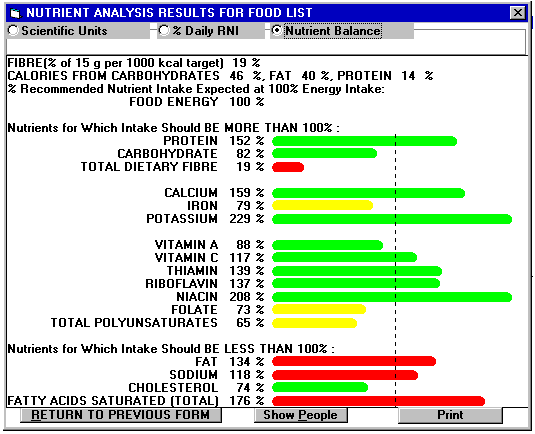
When you select the "Nutrient Balance" display option, you will notice two changes from the previous display:
- The line near the top of the display that described the number of people and the length of time is replaced with the statement "% Recommended Nutrient Intake at 100% Energy Intake:"
- The food energy is changed to 100%.

The nutrients in food are still compared against the same nutrient recommendations and guidelines. The difference is that adjustments are made to allow for the total amount of food. (If you have selected foods that represent more or less than 100% of the energy value in the RNI, the food quantity is temporarily adjusted down or up to match 100% of the recommended energy intake before the nutrient content is compared to RNI's.) This display helps you answer questions like "Do these foods represent a balanced diet?".